|
Historical Biogeography
|
||||||||||||||||||||||||||||||||
|
What are the evolutionary forces underlying the formation of highly diverse tropical aquatic ecosystems? The Neotropics encompasses one of the greatest concentrations of organic diversity on Earth. In many groups of plants and animals, species richness reaches a zenith in the Neotropical rainforests. This is true for many groups of vascular plants, aquatic macrophytes, frogs, birds and mammals. The species richness of Neotropical freshwaters fishes in particular is unparalleled, which with more than 7,000 species represents a majority of the world’s freshwater fishes, and perhaps 10% of all known vertebrate species. Any general understanding of vertebrate evolution must therefore address the spectacular evolutionary radiations of Neotropical fishes. Historical biogeography is the study of animal distributions emphasiszing evolution and over evolutionary time scales, and using a combination of phylogenetic and distributional information. From a macroevolutionary perspective, net rates of diversification within a geographic region arise from differential rates of speciation, extinction and immigration. Although the precise mechanisms of these processes remain incompletely understood for most biotas, it clear that evolutionary diversification takes place in both space and time. That is to say, biodiversity, biogeography and paleontology are intimately related subjects. Understanding biodiversity therefore requires study of all the clades that constitute a regional biota, through the full extent of their geographic ranges, and for the entirety of their durations through geological time. A complete understanding of Neotropical freshwater biodiversity therefore requires accurate information from many fields, employing data, concepts and methods from taxonomy, phylogenetics, biogeography, ecology, behavior, natural history, paleontology, and geology. This then is the full provenance of the study of Historical Biogeography.
|
||||||||||||||||||||||||||||||||
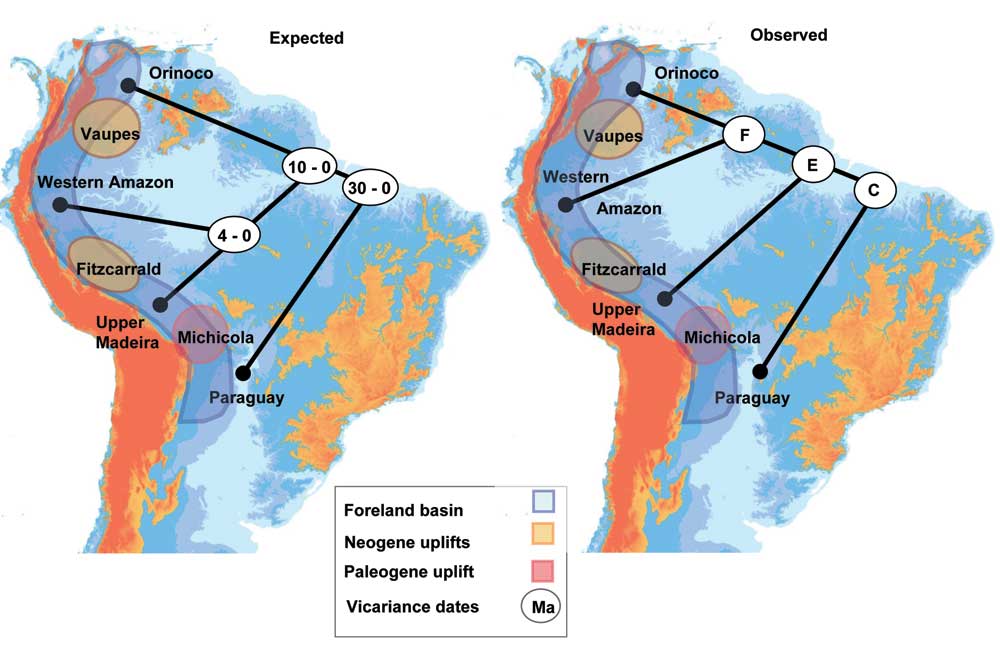
| Sequence of basin isolation as assessed from geological and phylogenetic data. A. Fragmentation of the Sub-Andean foreland from Lower Oligocene to Middle Miocene (c. 30 - 10 Ma). B. General area cladogram from analysis of 32 fish species phylogenies. Base map of elevations from SMRI data in a DEM by Paulo Petry. | ||||||||||||||||||||||||||||||||
|
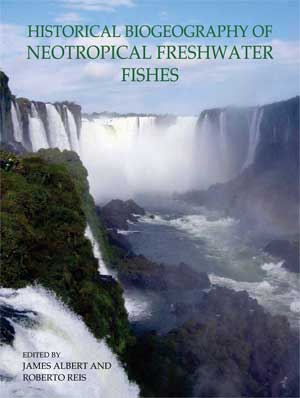
See forthcoming book: Historical Biogeography of Neotropical Fishes. Edited by James S. Albert and Roberto E. Reis
|
||||||||||||||||||||||||||||||||
 |
||||||||||||||||||||||||||||||||
 |
||||||||||||||||||||||||||||||||
|
COVER
|
TABLE OF CONTENTS
|
|||||||||||||||||||||||||||||||
| The Iguaçu Falls on the Paraná River, an important barrier and corridor, respectively, to dispersal in freshwater fishes. | ||||||||||||||||||||||||||||||||
 |
||||||||||||||||||||||||||||||||
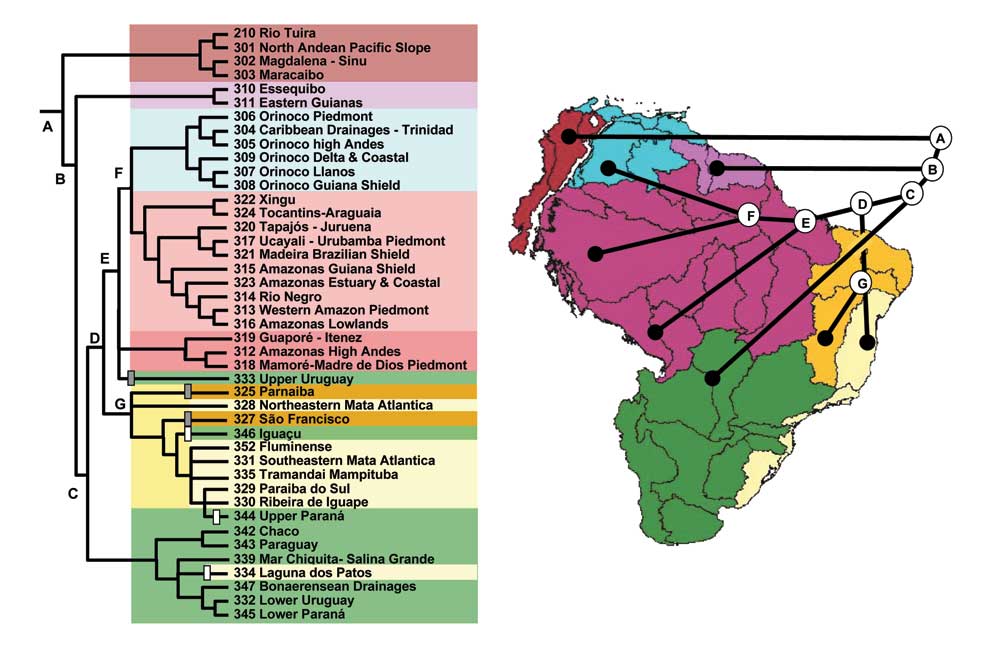
| Brooks Parsimony Analysis freshwater ecoregions of tropical South America. Data for 32 published fish phylogenies with 333 species and 317 components distributed in 45 ecoregions. A. Tree topology showing unambiguously optimized vicariance events. White bars indicate unambiguously optimized geodispersal events. Gray bars indicate (ambiguously optimized) vicariance / geodispersal events. B. Geographic distribution of nodes A-F plotted on a map of ecoregions (gray lines) and primary river basins (colored regions). Roman letters and colors matched in the two panels. | ||||||||||||||||||||||||||||||||
| Home | Teaching | People | Publications | In the Lab | ||||||||||||||||||||||||||||